http://lucyrp.livejournal.com/ (![[identity profile]](https://www.dreamwidth.org/img/silk/identity/openid.png) lucyrp.livejournal.com) wrote in
lucyrp.livejournal.com) wrote in ![[community profile]](https://www.dreamwidth.org/img/silk/identity/community.png) otw_news2012-07-25 10:22 am
otw_news2012-07-25 10:22 am
Spotlight on Support: AO3 ticket stats
This is going to be a very boring post. It's going to be full of numbers, and graphs, those things that I may or may not have spent many years at school colouring in with lovely coloured pencil without understanding them much (because I was apparently too much of an innocent mind to turn them into rude, crude approximations of things not related to mathematics except in the most abstract sense), and yet, these will be very easy to understand numbers. I am not a statistician, nor are the levels of data I have access to very deep. What I am is a member of the Support Committee with a curiosity about the numbers and types of tickets that pass through our hands, and who decided to add up the numbers one day and turn them into graphs. That was last year, and somehow the lure of the bar chart means that I have continued to collate information through to where we are right now, having just finished the second quarter of 2012.
In this post, I'm going to summarise the types of tickets received, what categories they fall under, and the general trends we witness. But first, some explanation of the process.
I'm sure that the method I have used is going to come under some degree of criticism for being inefficient; however, our Support software, provided by 16bugs (see Sam's spotlight post for more information) was not designed for data export. This means that the only way to extract numbers of tickets is to do it manually. And by manually, I mean I go through the email duplicates of each ticket one by one, assigning them a category, then add up the numbers for each month and enter them into an Excel spreadsheet.
What this method is, for all its faults, is quick, which means that I can rapidly pull up a given time period to see what sort of tickets were received between those dates. These graphs were originally created as an informal overview of ticket stats (which is a position they remain in – production of these stats is not an official Support Committee duty). They are simply counts of the original tickets, what they are about, and when they were received. They are not a count of how quickly they were responded to, who responded to what, or what follow ups were conducted with the users.
I'm going to leave direct explanations of the categories until the sections for the respective quarters, as these change on a quarter-by-quarter basis. This is due to the simple fact that new features are added, which generates new issues, and old issues are resolved. For example, squid caching was not implemented until June of this year, so prior to that, it was not shown in the graphs because issues relating to it did not occur. Here I'll instead explain the process by which tickets are categorised.
If you've ever submitted a comment or query to Support you will notice that on our form is a drop down menu.

These categories are not the ones I have used to sort tickets. Since the categories in the menu are so few and so broad, I felt it necessary to granulate them further, and count tickets as they related to specific archive functions and features.
If a new category is created in my sorting, it's because an issue got a large number of tickets and wasn't a transient bug. For example, if a ticket is related to subscription emails, it is categorised under "Subscriptions", not "Email" because it is related to a specific Archive function (in this case subscriptions) that has an existing category. If it were related to invitation emails, it would go under "Accounts/Invitations/Login". However, if it's related to kudos batching, it goes under general "Emails", because there is no category for kudos.
I won't linger on 2011 too much (see Q1 2012 for an explanation of categories), since this information was a little more awkwardly hacked together than for 2012 – by which time I had sorted out my process for quickly organising tickets.

(full size)
Prior to August, tickets were collated by the Support Chair, using slightly different categories than I did. I attempted to meld the two sets of information as best I could to produce the above year overview.
What is easily and clearly visible is the spike in tickets in November, resulting from a change to the front-end presentation of the AO3. The biggest spike is split between Interface/CSS tickets and Feedback. While many of the tickets sorted under Feedback were directly related to the changes to the AO3's interface, they did not contain bug reports or requests for information, and therefore fell under the heading of Feedback.
Categories for Q1 2012:

(full size)
Possibly due to the fact that the holidays are still going on at the beginning of January (and thus, people have more time to spend on fandom sites) we saw more tickets in general than during the following two months.
Categories added for Q2 2012:

(full size)
To break down the invitations emails, in June we received 140 tickets related to Invitations.
The remaining 37 tickets in that category were related to account activation or login issues.

(full size)
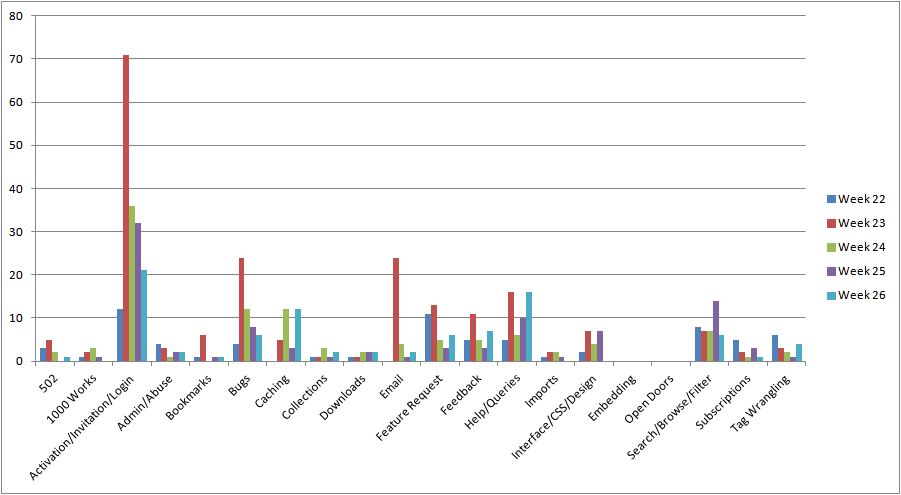
This graph shows how the tickets were distributed during the weeks that span the month of June. In week 23 (commencing 4th June) we received the greatest number of queries regarding invites, as this was the point at which the invitations queue started growing at the rate of nearly 1000 new additions per day (a rate since slowed to around 300-odd per day). This coincided with the point at which the AO3 servers started creaking under the strain of lots more visitors and a filtering system that was originally designed with a smaller user base in mind.
When squid caching was implemented to help ease the strain (around week 24) we saw an increased number of tickets related to this change. In week 25, when filtering was disabled, we began to see an increased number of tickets related to that. (Originally, the message was ill-worded, appearing to be an error message, rather than an admin message – this has since been altered, and tickets regarding the filtering being 'down' have disappeared.)
I always have fun posting these stats to the support committee. Everyone already knows more-or-less how things have gone, but sometimes looking at the numbers surprises us. When I originally created them, one frequent question was "what's the most common ticket you get" to which we would generally reply "queries regarding the 1000 work limit". I was curious as to whether this was actually the case. As it turned out, Feature Requests came in more often. Questions about the 1000 Works came lower down the list.
If you are wondering how many tickets we answer altogether, I can tell you that at the time of writing there are no unanswered tickets in our support software (except for one bugged ticket, which we are attempting to resolve with 16 Bugs). Every single ticket we receive is read and personally answered by a member of our staff, usually within a day or two. So, the answer is: we answer all of them.

(full size)
This post by Support staffer Yshyn. If you find a bug, have a question about the site, or want to request a feature, you can submit a Support request.
Mirrored from an original post on the Archive of Our Own.
In this post, I'm going to summarise the types of tickets received, what categories they fall under, and the general trends we witness. But first, some explanation of the process.
Collecting The Numbers
I'm sure that the method I have used is going to come under some degree of criticism for being inefficient; however, our Support software, provided by 16bugs (see Sam's spotlight post for more information) was not designed for data export. This means that the only way to extract numbers of tickets is to do it manually. And by manually, I mean I go through the email duplicates of each ticket one by one, assigning them a category, then add up the numbers for each month and enter them into an Excel spreadsheet.
What this method is, for all its faults, is quick, which means that I can rapidly pull up a given time period to see what sort of tickets were received between those dates. These graphs were originally created as an informal overview of ticket stats (which is a position they remain in – production of these stats is not an official Support Committee duty). They are simply counts of the original tickets, what they are about, and when they were received. They are not a count of how quickly they were responded to, who responded to what, or what follow ups were conducted with the users.
Categories
I'm going to leave direct explanations of the categories until the sections for the respective quarters, as these change on a quarter-by-quarter basis. This is due to the simple fact that new features are added, which generates new issues, and old issues are resolved. For example, squid caching was not implemented until June of this year, so prior to that, it was not shown in the graphs because issues relating to it did not occur. Here I'll instead explain the process by which tickets are categorised.
If you've ever submitted a comment or query to Support you will notice that on our form is a drop down menu.
These categories are not the ones I have used to sort tickets. Since the categories in the menu are so few and so broad, I felt it necessary to granulate them further, and count tickets as they related to specific archive functions and features.
If a new category is created in my sorting, it's because an issue got a large number of tickets and wasn't a transient bug. For example, if a ticket is related to subscription emails, it is categorised under "Subscriptions", not "Email" because it is related to a specific Archive function (in this case subscriptions) that has an existing category. If it were related to invitation emails, it would go under "Accounts/Invitations/Login". However, if it's related to kudos batching, it goes under general "Emails", because there is no category for kudos.
The Stats
2011, In Brief
I won't linger on 2011 too much (see Q1 2012 for an explanation of categories), since this information was a little more awkwardly hacked together than for 2012 – by which time I had sorted out my process for quickly organising tickets.
(full size)
Prior to August, tickets were collated by the Support Chair, using slightly different categories than I did. I attempted to meld the two sets of information as best I could to produce the above year overview.
What is easily and clearly visible is the spike in tickets in November, resulting from a change to the front-end presentation of the AO3. The biggest spike is split between Interface/CSS tickets and Feedback. While many of the tickets sorted under Feedback were directly related to the changes to the AO3's interface, they did not contain bug reports or requests for information, and therefore fell under the heading of Feedback.
Q1 2012
Categories for Q1 2012:
- Error 502 - the 'server busy' messages
- 1000 Works - queries related to why we have a 1000 work limit on the fandom landing pages
- Activation/Invitation/Login - problems activating accounts, getting invitations, or logging in
- Admin/Abuse - issues that need to be examined by Admin or Abuse teams
- Bug Report - Reports of transient bugs that aren't separately categorised
- Collection/Challenges/Prompts - any problems/queries about these
- Downloads - errors, bugs, queries related to downloading
- Feature Request - any 'can I have/I would like/will you implement' queries
- Feedback - any complaints, or any positive feedback (alone with no other feature-related issue)
- Help/Information - any questions about AO3/OTW in general, or how to use specific features
- Interface/CSS/Display - problems/queries relating to how the archive appears on screen, i.e. interface
- Imports - issues with importing from LiveJournal/Fanfiction.net/other
- Open Doors - questions related to fics imported through OD
- Search/Browse/Filter - Problem or queries about sorting through archive contents
- Tag Wrangling - any tag related questions
(full size)
Possibly due to the fact that the holidays are still going on at the beginning of January (and thus, people have more time to spend on fandom sites) we saw more tickets in general than during the following two months.
Q2 2012
Categories added for Q2 2012:
- Embedding – queries/problems with embedding media (images/audio/video) into Works pages
- Bookmarks – queries/problems involving bookmarking
- Caching – bug reports that are actually caching issues (e.g., reporting 0 works in a fandom as a bug – this is a caching issue, or appearing as logged in as another user). The kind of caching which causes these particular bugs was only implemented in June.
- Email – email issues unrelated to other categories (e.g., kudos email batching)
- Subscriptions – issues/queries to do with the subscribe feature
(full size)
To break down the invitations emails, in June we received 140 tickets related to Invitations.
- How Do I Use This Invite: 22
- Did Not Receive Invitation Email: 31
- Fell Off Invite List (unaware of security changes): 41
- (of those, who admitted to re-adding themselves: 6)
- General Invite Queue Unhappiness: 10
- Can I have An Invite?: 9
- I Requested Invites, Where Are They?: 12
- Paid Accounts: 3
- My friend on FF.net needs an invite: 12
- Need Invites for a Challenge: 5
- Please Remove Me From Queue: 1
The remaining 37 tickets in that category were related to account activation or login issues.
(full size)
This graph shows how the tickets were distributed during the weeks that span the month of June. In week 23 (commencing 4th June) we received the greatest number of queries regarding invites, as this was the point at which the invitations queue started growing at the rate of nearly 1000 new additions per day (a rate since slowed to around 300-odd per day). This coincided with the point at which the AO3 servers started creaking under the strain of lots more visitors and a filtering system that was originally designed with a smaller user base in mind.
When squid caching was implemented to help ease the strain (around week 24) we saw an increased number of tickets related to this change. In week 25, when filtering was disabled, we began to see an increased number of tickets related to that. (Originally, the message was ill-worded, appearing to be an error message, rather than an admin message – this has since been altered, and tickets regarding the filtering being 'down' have disappeared.)
And This All Means...
I always have fun posting these stats to the support committee. Everyone already knows more-or-less how things have gone, but sometimes looking at the numbers surprises us. When I originally created them, one frequent question was "what's the most common ticket you get" to which we would generally reply "queries regarding the 1000 work limit". I was curious as to whether this was actually the case. As it turned out, Feature Requests came in more often. Questions about the 1000 Works came lower down the list.
If you are wondering how many tickets we answer altogether, I can tell you that at the time of writing there are no unanswered tickets in our support software (except for one bugged ticket, which we are attempting to resolve with 16 Bugs). Every single ticket we receive is read and personally answered by a member of our staff, usually within a day or two. So, the answer is: we answer all of them.
(full size)
This post by Support staffer Yshyn. If you find a bug, have a question about the site, or want to request a feature, you can submit a Support request.
Mirrored from an original post on the Archive of Our Own.